环境:CentOS Linux release 7.5.1804 (Core)、5.5.60-MariaDB
运行方式:Prometheus,Grafana和Alertmanager通过docker安装运行,MySQL和exporter直接运行在VM上
安装
1 | docker pull prom/prometheus |
执行prometheus前,先配置好以下文件。
1 | [root@zabbix02 ~]# tree config/ |
- prometheus.yml
1 | global: |
- rules.yml
1 | groups: |
- alertmanager.yml
1 | global: |
这里不使用docker方式运行exporter,通过下载安装包安装node_exporter和mysqld_exporter。
- 安装、启动node_exporter
1 | wget https://github.com/prometheus/node_exporter/releases/download/v0.17.0/node_exporter-0.17.0.linux-amd64.tar.gz |
- 安装、启动mysqld_exporter
1 | wget https://github.com/prometheus/mysqld_exporter/releases/download/v0.11.0/mysqld_exporter-0.11.0.linux-amd64.tar.gz |
- 运行prometheus
1 | docker run -d -p 9090:9090 --name prometheus --net=host \ |
- 运行alertmanager
1 | docker run -d -p 9093:9093 --net=host \ |
- 安装及配置grafana
要通过grafana展示监控数据,见https://github.com/zlzgithub/docs/blob/master/grafana/grafana-intro.md
以上步骤就绪后,通过浏览器访问看看
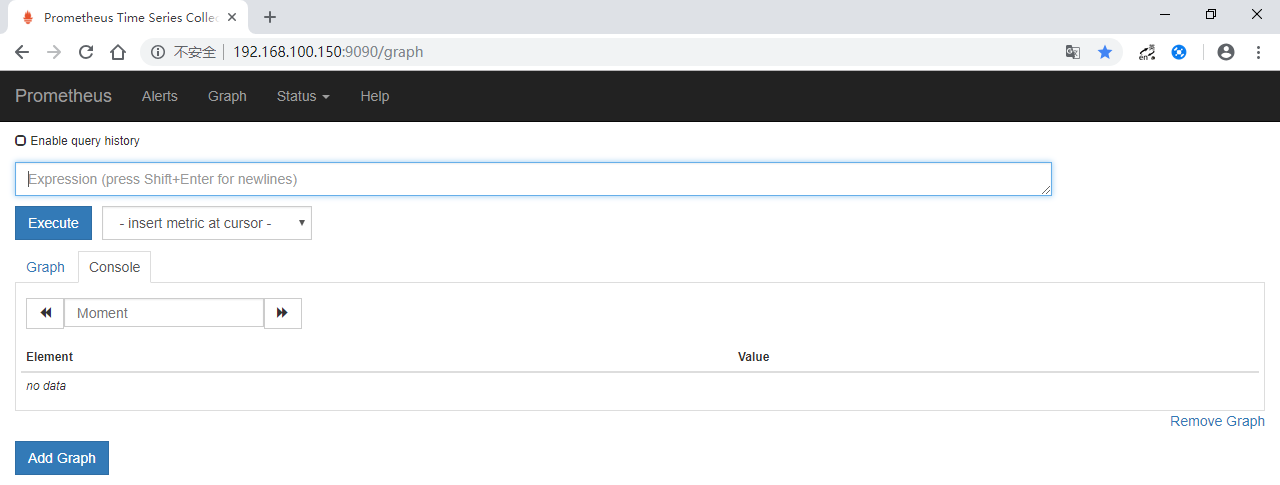
- Prometheus首页
http://192.168.100.150:9090/graph
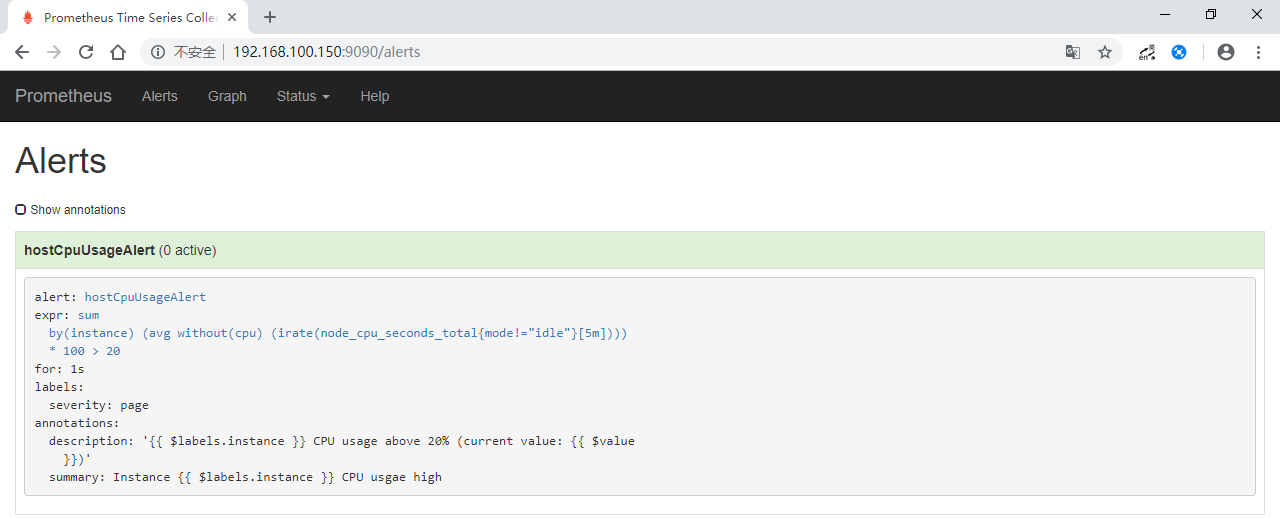
- Alerts页面
http://192.168.100.150:9090/alerts,显示了一条报警规则,说明此前的prometheus rules配置正常。
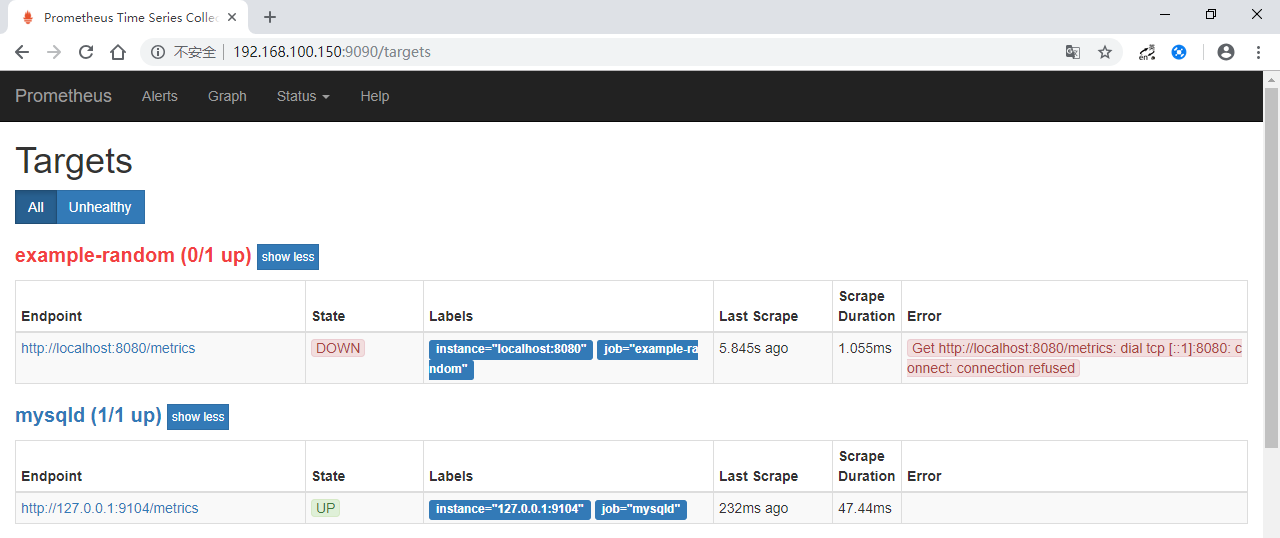
- Targets页面
http://192.168.100.150:9090/targets,显示了已在线的metrics。
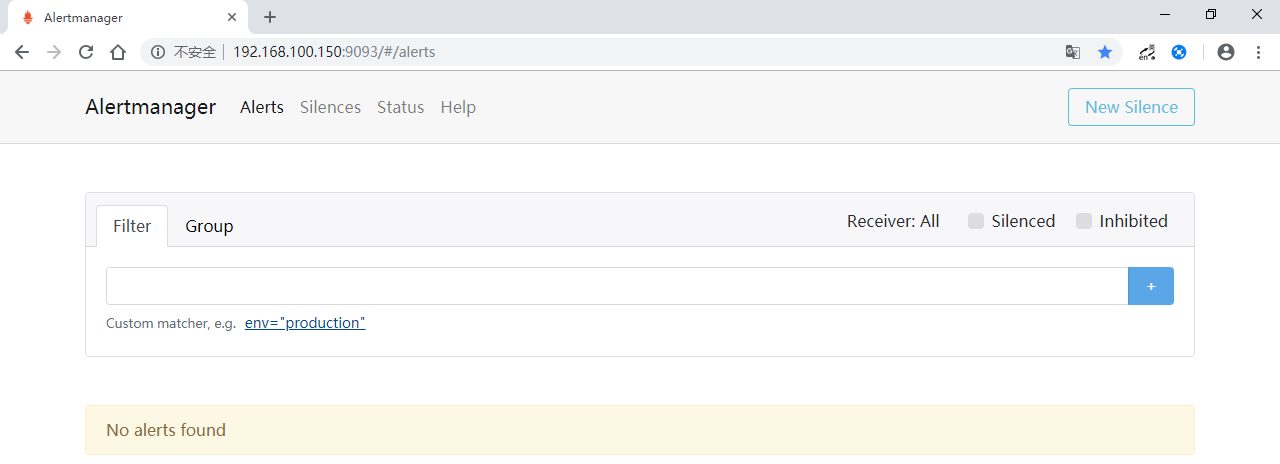
- Alertmanager
http://192.168.100.150:9093/#/alerts
- metrics
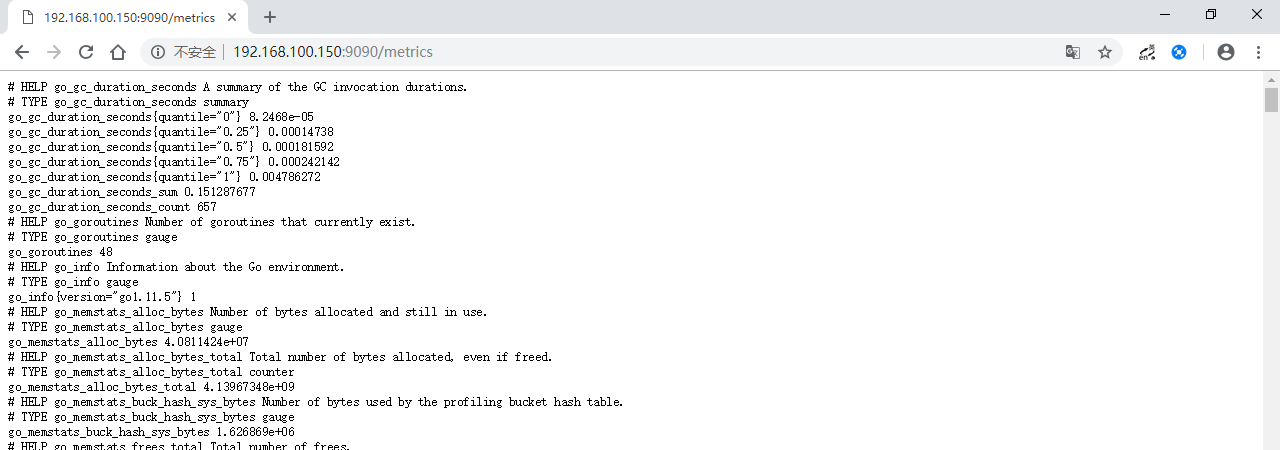
- prometheus的metrics
http://192.168.100.150:9090/metrics
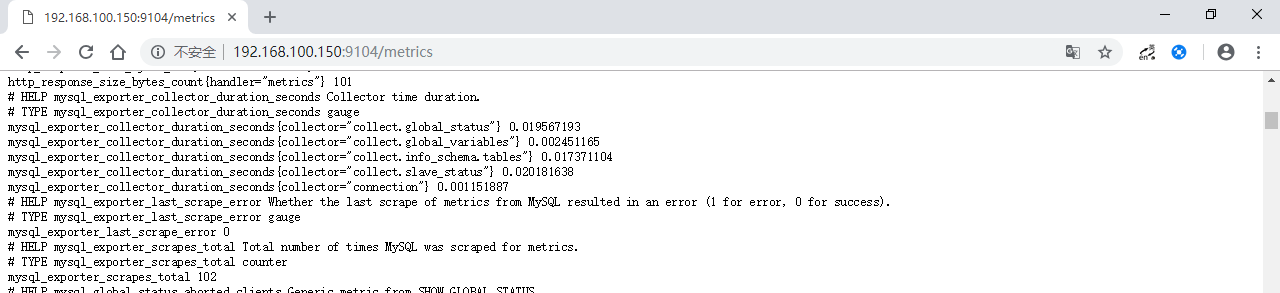
- mysql的metrics
http://192.168.100.150:9104/metrics
功能测试
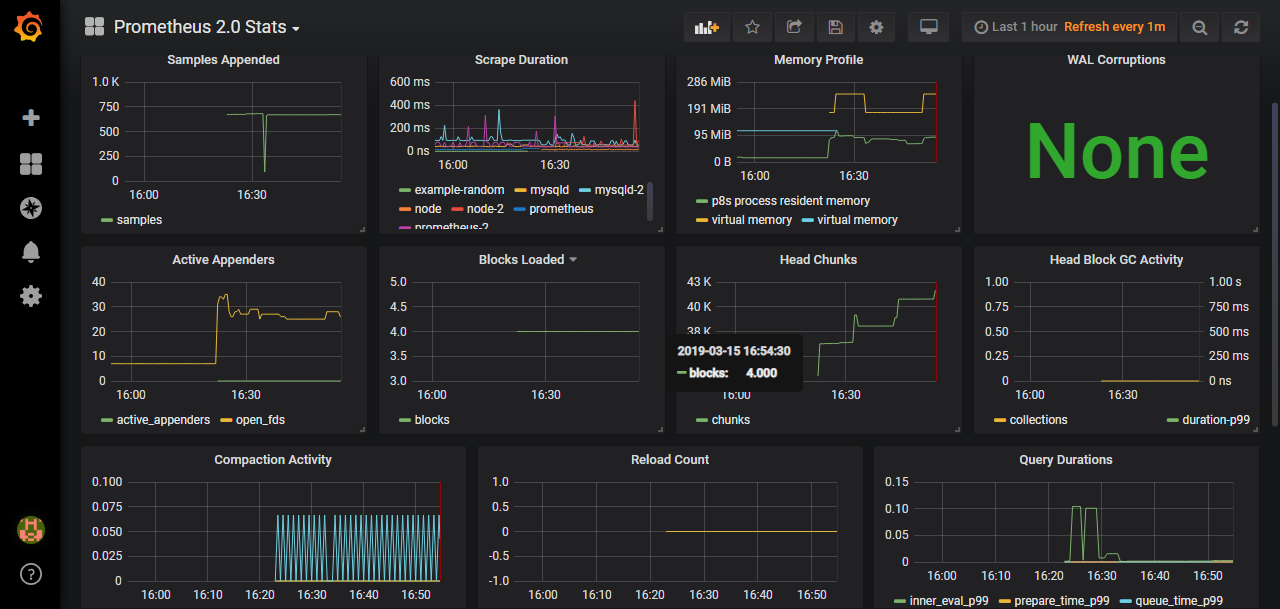
在Grafana中,导入Prometheus 2.0 Status仪表板,显示如下:
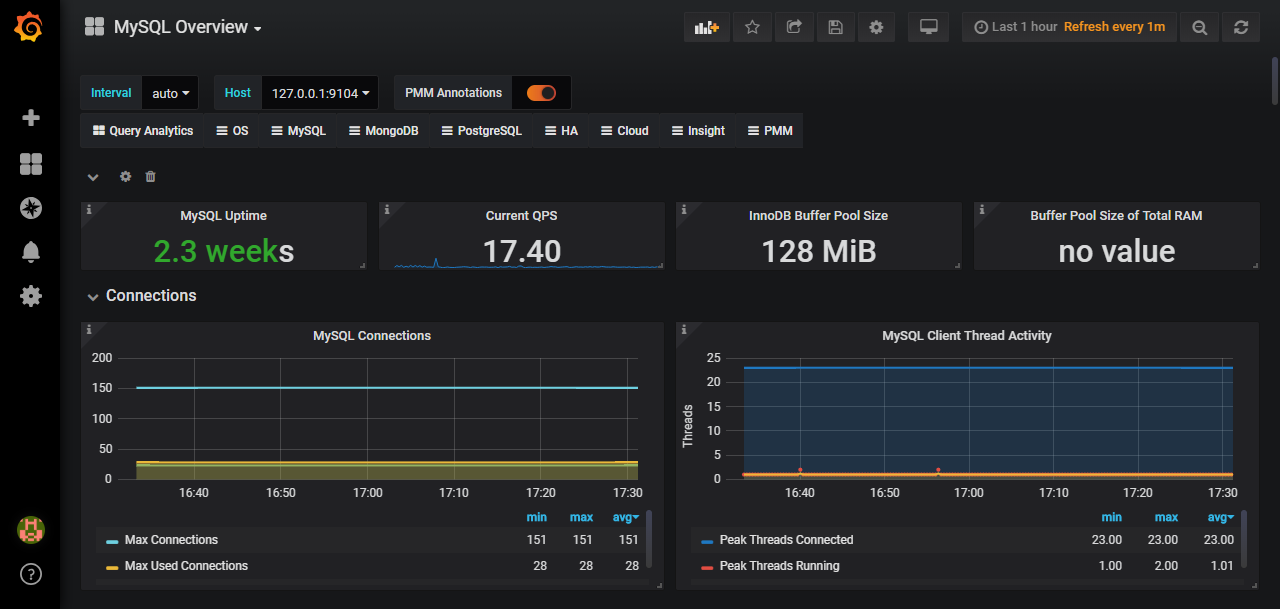
导入Mysql-Overview模板的显示效果:
报警测试:
1 | # 先运行一个webhook,前提已安装golang |
alertmanager webhook在控制台输出的日志:
1 | [root@VM_0_2_centos alertmanager]# webhook |
当CPU使用率高于20%时,Prometheus Alerts页面的报警状态先后变化顺序:in active -> pending -> firing;恢复后,日志显示resolved。
在报警项resolved之前,Alertmanager页面:
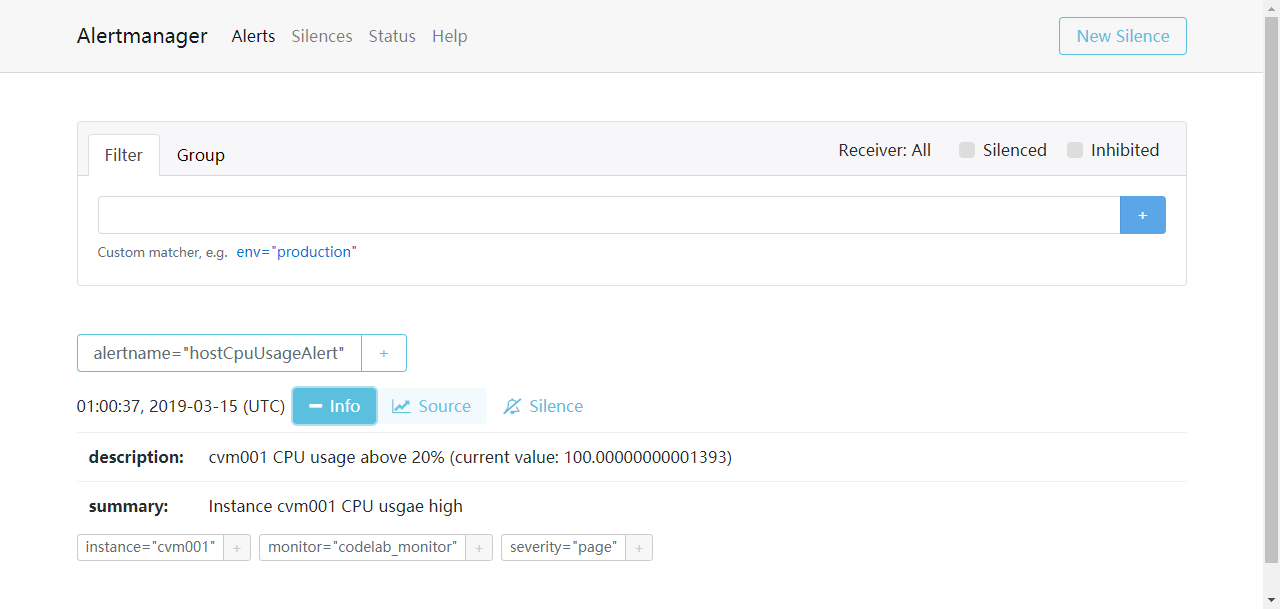
通过测试可以看出,webhook方式发出通知是正常的。未测试email和企业微信。
(End)